

Copyright © 2019 - 2026 AR Webcrafts LLC. | All Rights Reserved
- Welcome, We Transform Your Concepts into Reality.
A custom LearnDash add-on that generates fully filterable, CSV-exportable quiz reports for admins, group leaders, and instructors — built by AR Webcrafts.
A training platform managing hundreds of students across dozens of courses had a data problem. LearnDash’s built-in reporting was too basic — it showed overall scores but couldn’t tell instructors which specific questions students were failing, how much time they spent on each quiz, or how performance compared across groups. The platform’s group leaders had no reporting tools at all. Decisions about course content were being made on gut feeling rather than data, and nobody could see the full picture of student performance across the entire platform.
LearnDash’s native quiz reporting is limited to basic score exports — no question-level analytics, no time tracking, no group-level breakdowns
Group leaders had zero reporting access — they could not see how their students were performing on quizzes
Instructors had no way to identify which specific questions were causing the most failures — content improvement was guesswork
No scheduled reporting — admins had to manually generate and download reports whenever data was needed
No visual analytics — all data was raw numbers with no charts or graphs to identify patterns at a glance
No shortcode to embed quiz reports on the frontend for group leaders to self-serve
"A huge portion of our students are in areas with unreliable internet. This add-on changed everything for them — they download the course on WiFi and study it on the go. It was one of the most requested features we'd ever had, and AR Webcrafts delivered it perfectly."
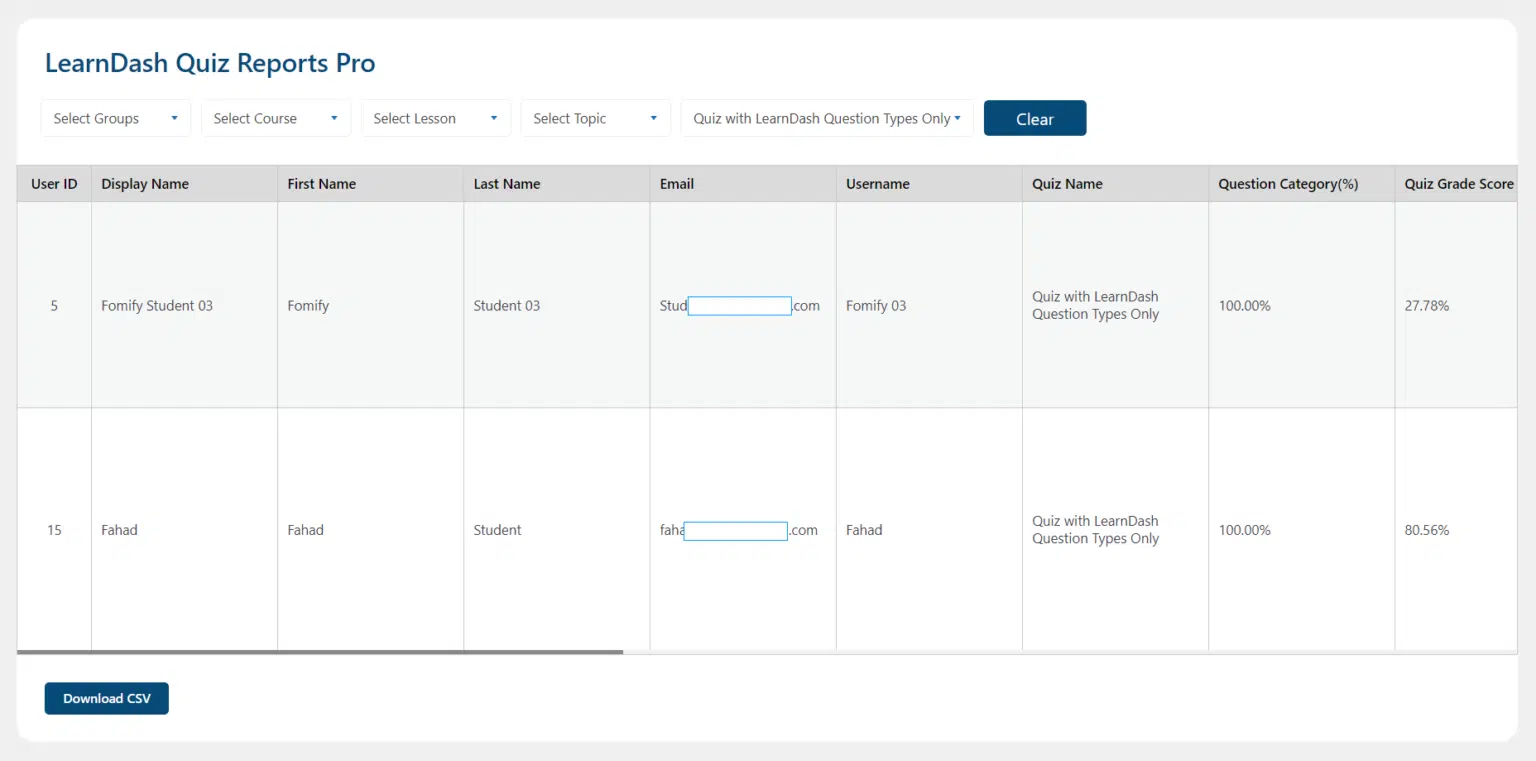
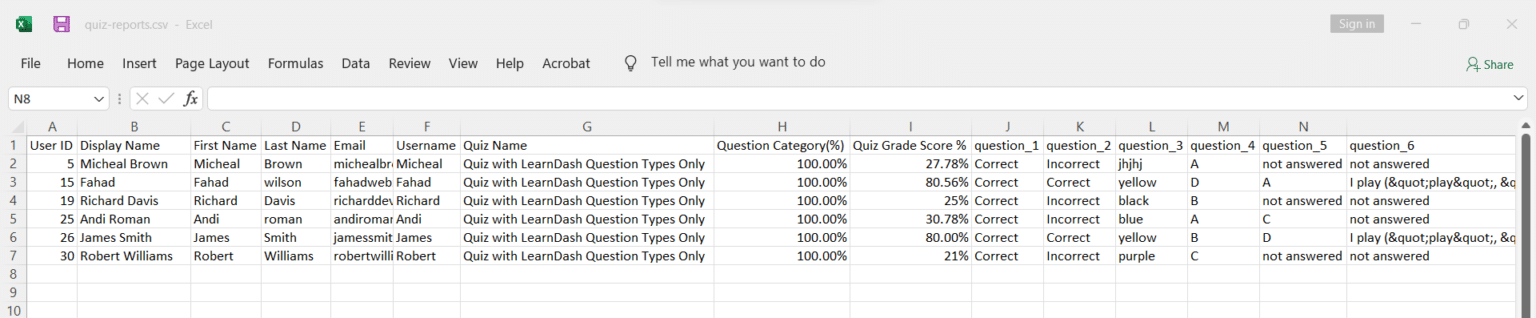
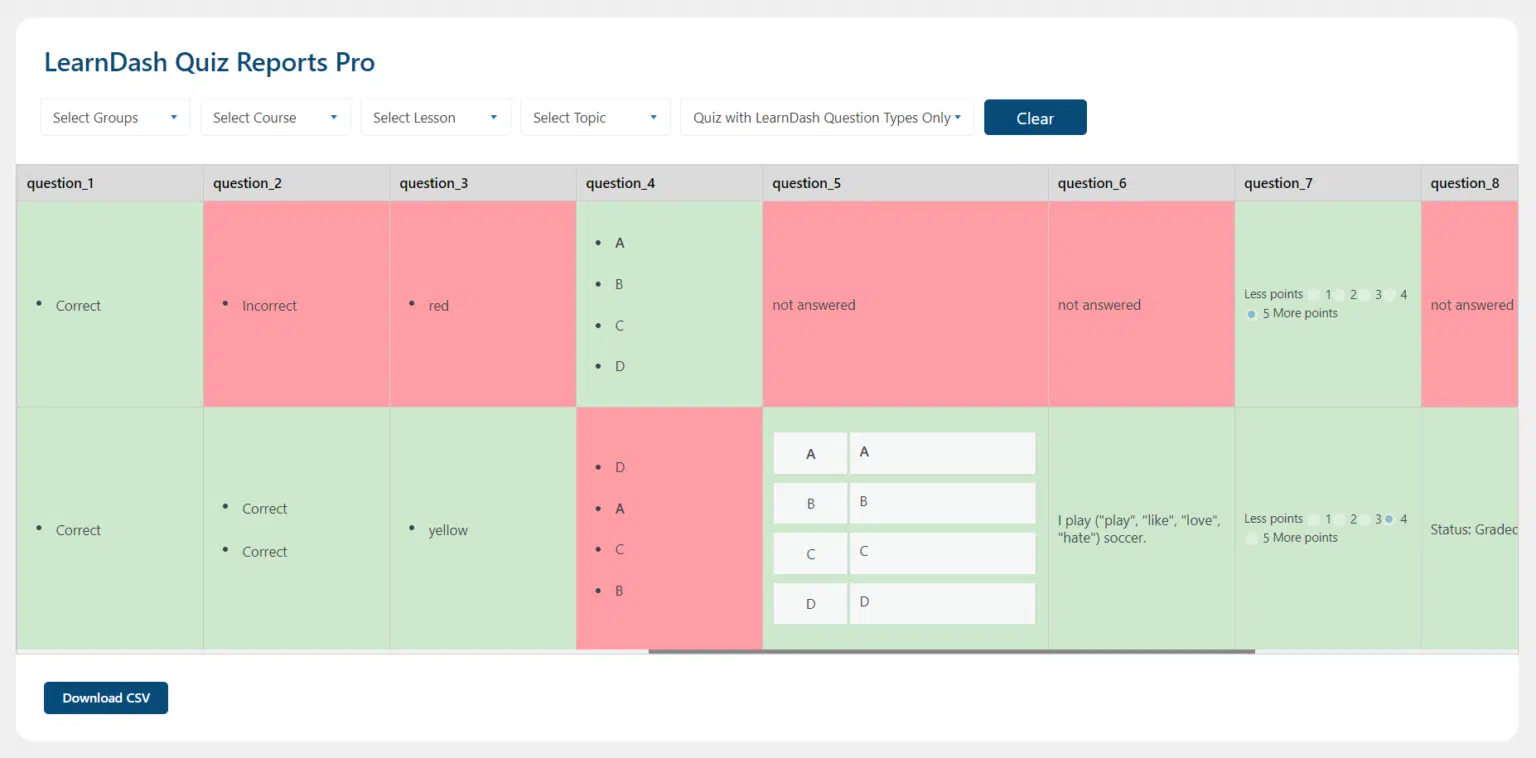
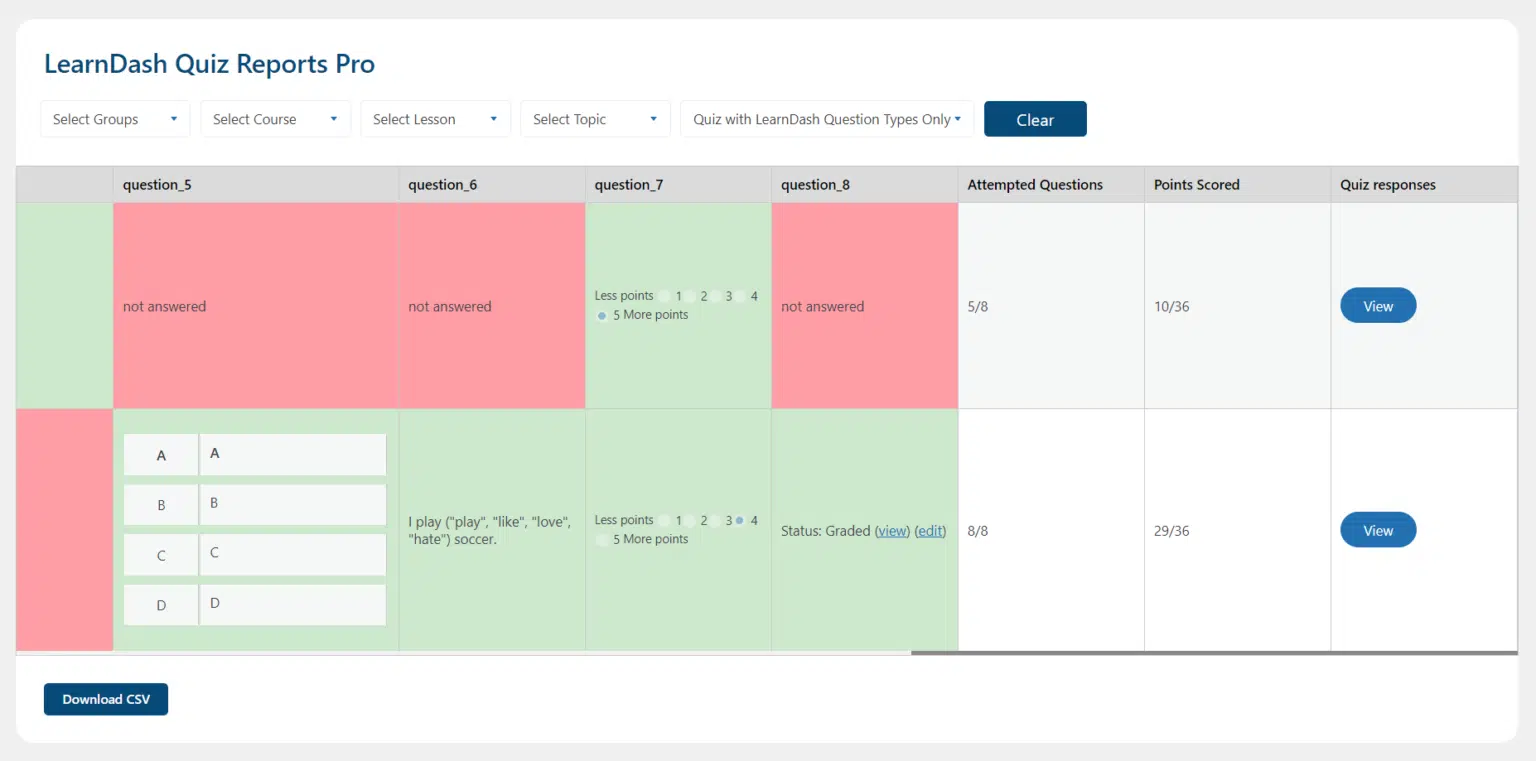
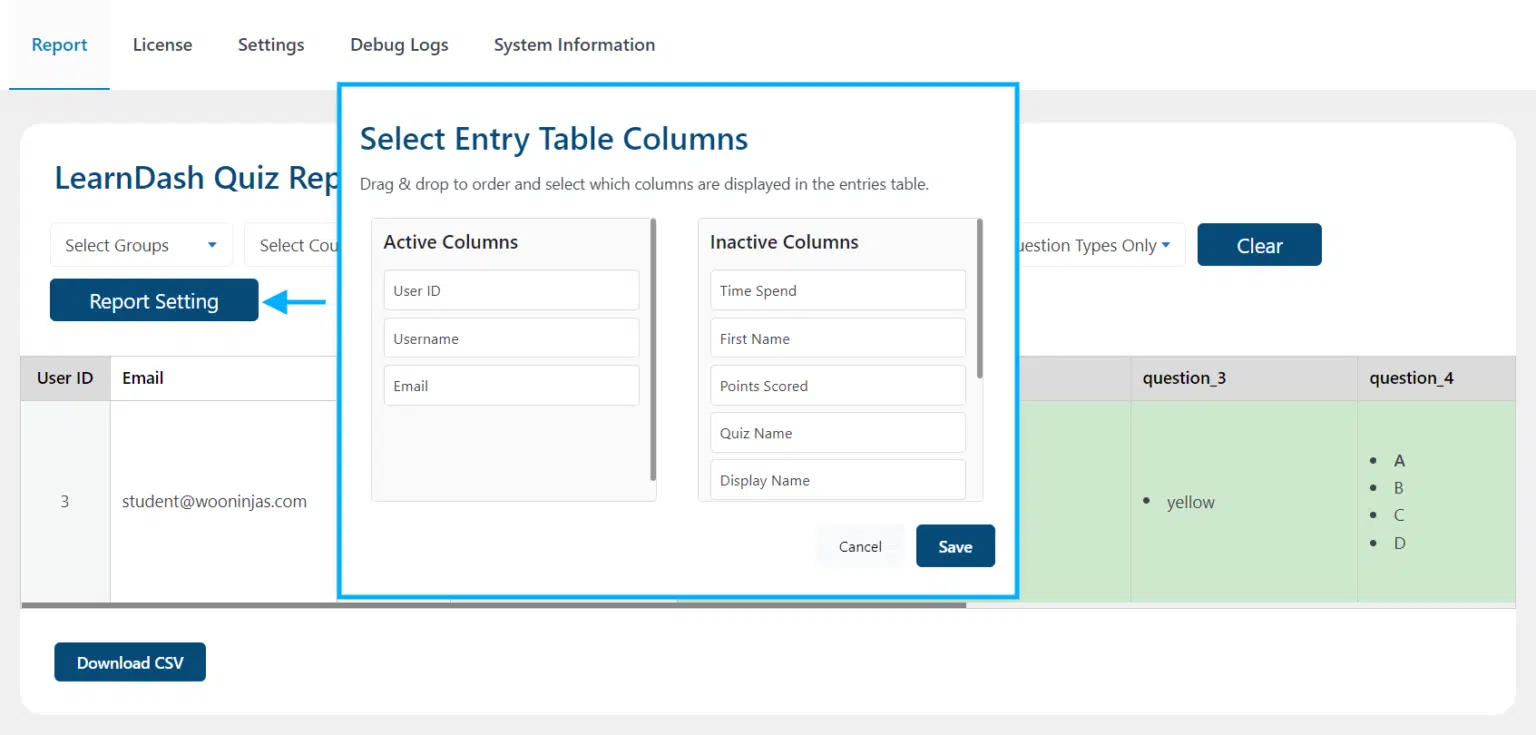
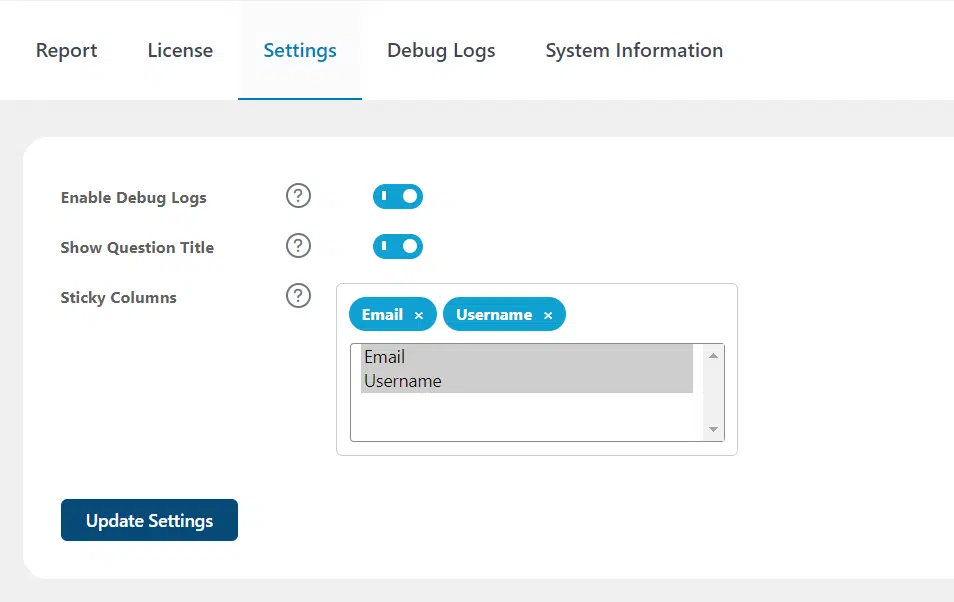
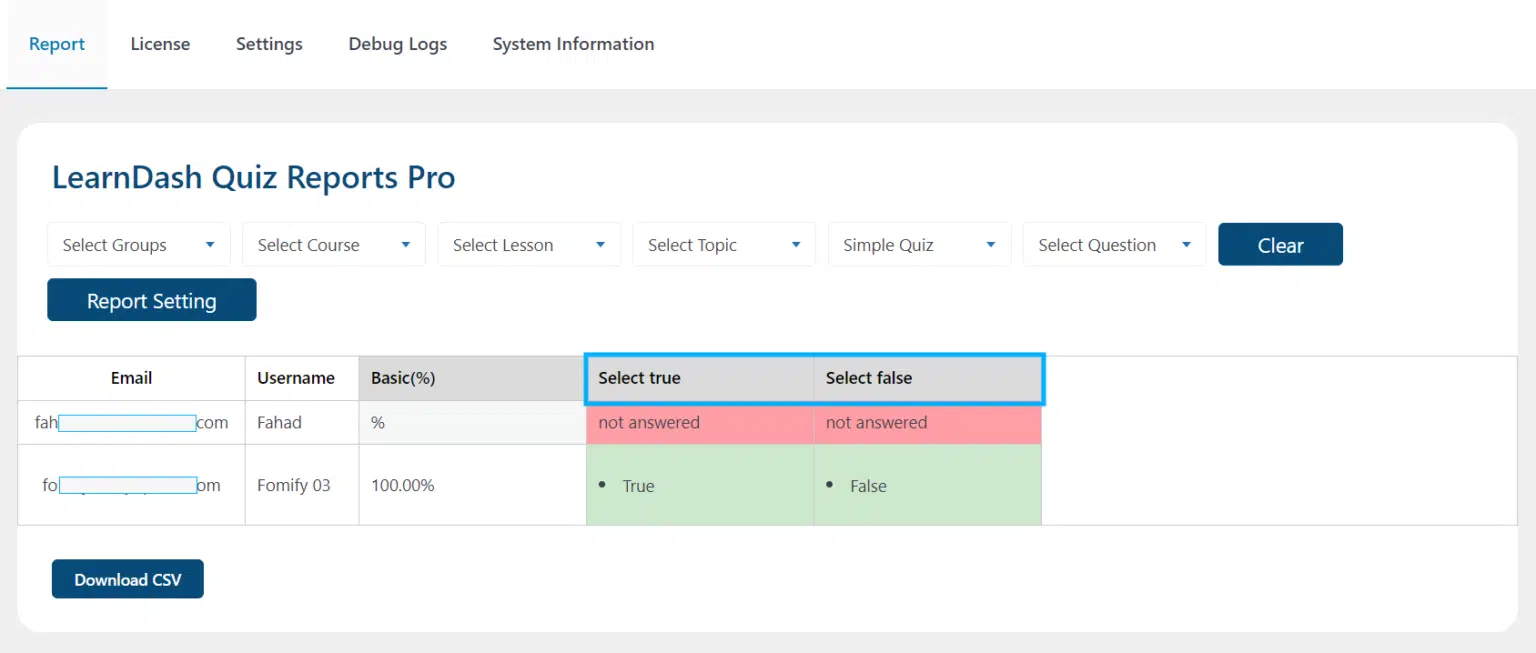
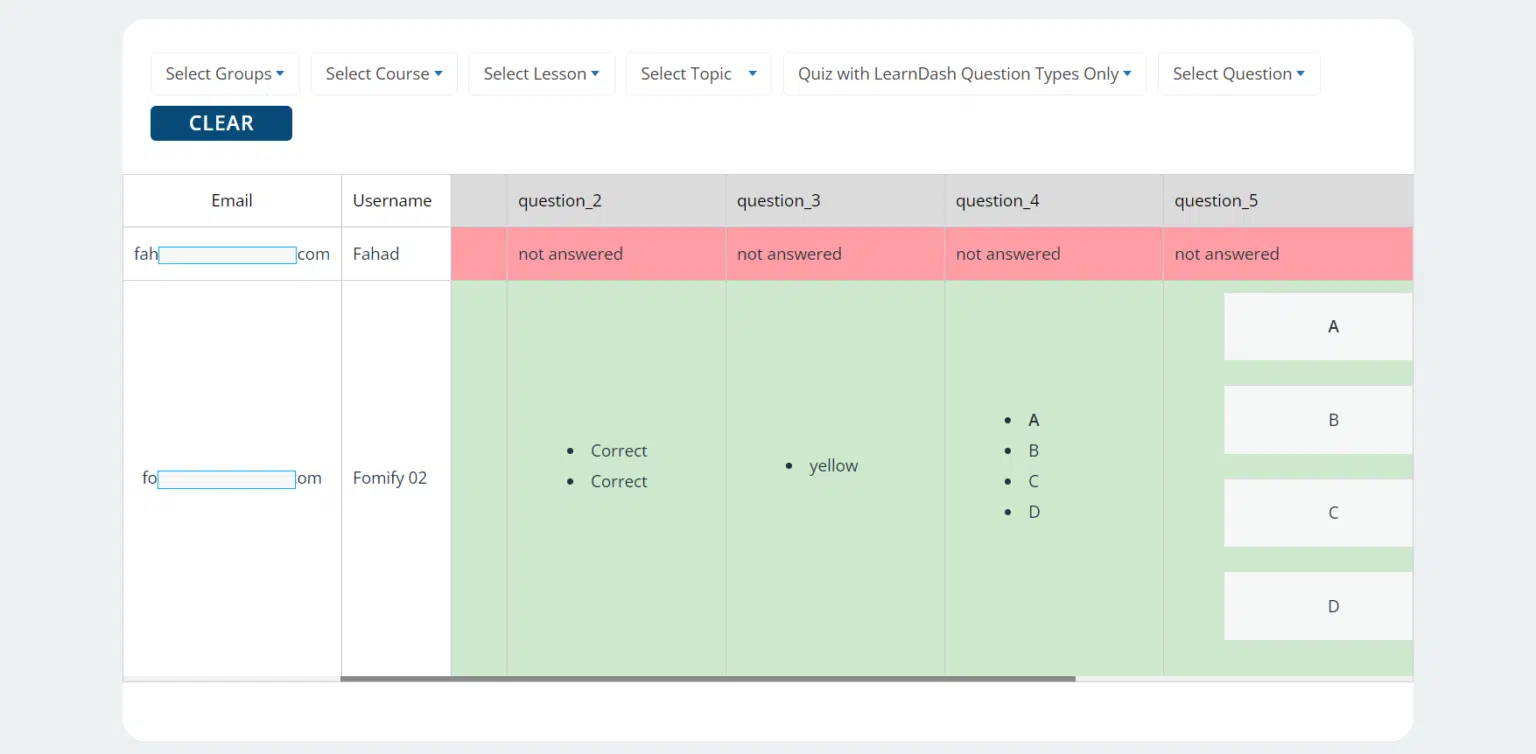
AR Webcrafts built a comprehensive quiz reporting system that plugs directly into the LearnDash backend and gives every user role the data they need. Admins can generate fully filterable quiz reports by group, course, lesson, topic, quiz, specific question, date range, and individual student — drilling down to exactly the data slice they need. Every report is downloadable as a CSV for use in spreadsheets, data tools, or record-keeping. A visual graphs module gives educators instant visual analysis of student performance — selecting specific graph types and searching by quiz to surface patterns quickly. For group leaders who need regular reporting, an automated Scheduled Reports system lets them set up one-time or recurring reports (daily, weekly, monthly, or custom) that generate and deliver automatically — no manual work required. A shortcode lets admins embed the quiz reports interface on any frontend page, giving group leaders self-serve access without backend permissions.
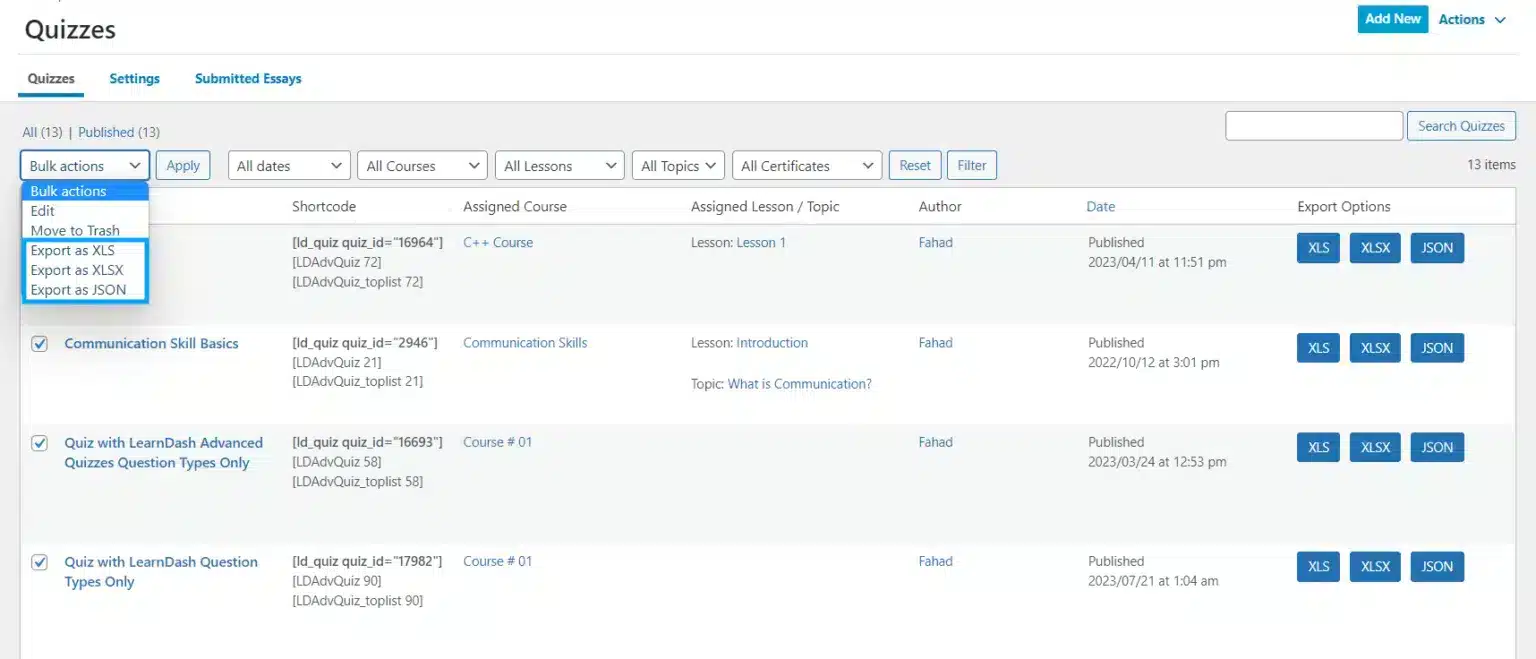
You can easily export/import all of your quizzes with a single click with LearnDash Quiz Import Export. Quiz questions are downloaded in a spreadsheet in XLS or XLSX formats.
We build custom analytics and reporting tools for LearnDash that give admins, instructors, and group leaders the insights they need to improve outcomes.
We build custom analytics and reporting tools for LearnDash that give admins, instructors, and group leaders the insights they need to improve outcomes.